2025 California City Managers Survey
CONTENTS
I. Introduction
What are the characteristics of the men and women who serve as California’s city managers? What are their demographic traits? Their educational backgrounds and prior work experiences? Their average length of service in their positions? What do they consider the most important issues facing their cities? And do these answers vary depending on the city’s size?
As the chief executive officers of hundreds of cities across the state, city managers are collectively California’s most important group of local government officials. Yet, until recently, little was known about the people who fill these critical positions.
In 2023, the California City Management Foundation (CCMF), joined by Tripepi Smith Talent Solutions and the California Joint Powers Insurance Authority, commissioned the Rose Institute of State and Local Government, an academic research institute at Claremont McKenna College, to survey the state’s city managers. The survey results were released in a report, 2023 California City Manager Survey: A Profile of the Profession, which presented the first in-depth, comprehensive look at these officials.
Building on that work, the California City Management Foundation (CCMF) commissioned the Rose Institute to conduct a second survey. Tripepi Smith and California Joint Powers Insurance Authority (California JPIA) provided additional support. The 2025 Survey expands on the 2023 report by including additional questions highlighting changes in our findings between 2023
and 2025.
Background on the City Manager System
The city manager system dates back to the Progressive Era of the late nineteenth and early twentieth centuries. During this period, critics of municipal government, such as Lincoln Steffens, author of The Shame of the Cities (1904), decried corruption and bossism in cities across the country, and organizations such as the National Municipal League (1894) were established to promote urban reform. The reformers argued that cities could be redeemed by introducing non-partisan, professional management.
Proponents of the professionalization movement emerged in many parts of the United States, with Californians exerting early leadership. A notable example was Haven H. Mason, a prominent city official in Santa Clara and later San Francisco, founder in 1898 of the League of California Municipalities (later known as the League of California Cities), and editor of the magazine California Municipalities. In an 1899 editorial in that journal, Mason advocated for a “distinct profession of municipal managers” that would have “sound business judgment” and apply “strict business principles.” Mason noted that city administration is a “business peculiar to itself” with “no other business concern like it in the commercial world.” As a result, he advocated that universities develop programs specially designed to prepare graduates “to enter the new profession of conducting municipal business.” Mason concluded that “[i]t would be an interesting experiment for a city to employ a professional manager, and it would very likely prove a successful experiment. Then ambitious young men would fit themselves for municipal employment and before long our cities would be managed by professional municipal officers instead of by professional politicians.”
Over the next two decades, several cities pursued these experiments. In 1904, the small city of Ukiah, in Northern California, became what seems to have been the first city in the nation to hire a chief executive, selected by the city council, although the office was not called “manager.” Other experiments followed in Staunton, Virginia (1908) and Sumter, South Carolina (1912). In 1914, Inglewood and Glendale became the first California cities to adopt the council-manager system, as it came to be known. That same year, the City Manager Association (later the International City/County Management Association, or ICMA) was established, providing an organizational structure for the new profession. In 1915, the National Municipal League adopted the manager plan in its Model City Charter, giving the concept widespread legitimacy and appeal.
Unlike in “strong mayor” cities where the mayor wields executive authority, in a council-manager system, the city manager acts as the chief executive and is charged with administering the full range of municipal operations. In council-manager cities, elected representatives (council and mayor) are expected to set policies, and the city manager implements them, although managers often share responsibility for policy formation. The role of a city manager is complex and requires a broad range of skills. City managers are expected to possess a high degree of education and training and to adhere to a set of professional values, norms, ethical standards, and practices. In 1985, the California City Management Foundation (CCMF) was founded in part to strengthen these professional norms and promote city management education.
California has embraced the council-manager form of municipal government more completely than the rest of the nation. In a 2016 study published by Common Cause, researcher Nicolas Heidorn found that 468 California cities (or 97%) used this system. Only five major cities in the state–Los Angeles, San Diego, San Francisco, Fresno, and Oakland–used a “strong mayor” or mayor-council system in which the elected mayor is the chief administrative officer, assisted by an appointed administrative official. A few small cities in California have decentralized the administration of government, with department heads reporting directly to the city council or to individual council members. As of 2018, California cities used the council-manager system at more than double the national rate. According to the ICMA 2018 Municipal Form of Government Survey, 48.2% of American cities
(n = 4,020 cities) reported they used the council-manager form of government, compared with 38.2% that used the mayor-council system.
“City manager” is the most common title used for the chief administrative officer in the vast majority of California cities. With the incorporation of the city of Mountain House in 2024, California currently has 483 incorporated cities. Of these, 435 use the title city manager (the survey includes in this category 407 current city managers, 21 interim city managers, 2 acting city managers, 2 assistant city managers, 2 city manager/finance directors, and 1 interim city manager/city planner). “City administrator” is the next most common title (21 cities, including a city clerk/administrator and city hall administrator, or 4% of the total), followed by town manager (18 cities, including 1 interim town manager, or 4% of the total). Except for the cities that have a strong mayor system of government, city managers, city administrators, and town managers perform functionally equivalent jobs. For the balance of this report, we use the term “city manager” to include all of these positions.
Although the council-manager system has become the dominant form of municipal government in California, prior to the Rose Institute’s surveys only limited research had focused on the state’s city managers as a group. A notable exception is the study of the status of women in the profession. ICMA has conducted research on the number and percentage of women chief administrative officers (including city managers and the highest-level county administrators) in California and across the nation. Those findings, presented in reports in 1976 and 2014 and in later updates, indicate that the number of women at the top level of local government management has increased over time, but that women remain underrepresented in those positions–23% in the United States and 27% in California as of 2024.
This report presents new information on city managers in California and provides a robust and updated profile of the profession.
II. Survey Methodology
The Rose Institute drafted this survey instrument in collaboration with CCMF and Tripepi Smith. See Appendix A. We collected survey data over the course of thirteen weeks beginning on Tuesday, February 18, 2025. We emailed a letter of introduction explaining the study to all city managers in California. The survey was conducted using Qualtrics software and took respondents less than five minutes to complete. We contacted city managers by email and phone over the next eight weeks to solicit responses to the online survey. We received responses from a total of 292 cities, for a response rate of 60%.
See Appendix B.
The research team supplemented the survey response data with information from publicly available sources such as city websites, newspaper articles, and LinkedIn. We gathered data on education, time in current position, prior position, major field of study, city council size and mode of election (at large vs. district), and method of election of the mayor. We were able to fill in data for many, but not all, of the cities that did not participate in this survey. We did not separately gather information related to city managers’ age, gender, or race; the data in those tables derive from survey responses only.
The research team then checked the data for accuracy and consistency. We also coded responses for Major Subject of Study and Most Pressing Issues. See Appendix C and Appendix D.
It is important to note that not every survey respondent answered every question. For example, 291 of the 292 respondents filled in the question on age, 288 of the 292 filled in the question on education, 274 of the 292 filled in the question on race or ethnicity, and 271 of the 292 filled in the question on prior government experience. Similarly, in some cases, the research team was able to gather only a portion of the supplemental data. Using publicly available sources, the research team was able to identify the highest degree earned for 153 city managers and the major subject studied for 150 city managers. The number of data points for each variable is noted under each table (N=__).
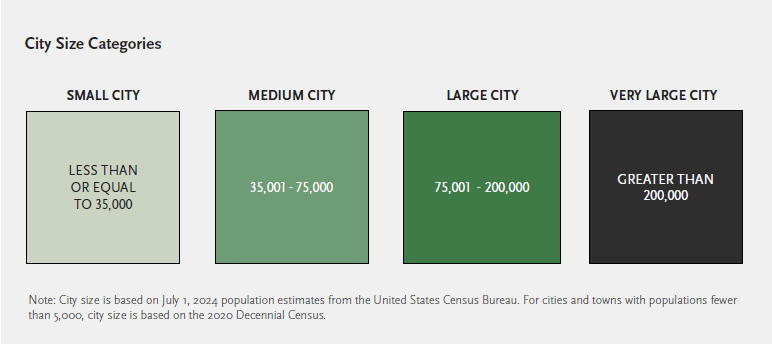
The research team also gathered population data for each city from the United States Census Bureau. We determined the population of most cities based on July 1, 2024 Census estimates. These population estimates are frequently adjusted. This survey uses the population estimates available from April 14 to April 22, 2025. For cities and towns with populations fewer than 5,000, we used figures from the 2020 Decennial Census. We then coded the cities into four size categories (small, medium, large, and very large) for the purposes of this study. Assigning a size code to each city is a useful analytic tool to see how city manager characteristics differ for cities of varying size.
III. Demographic Profile
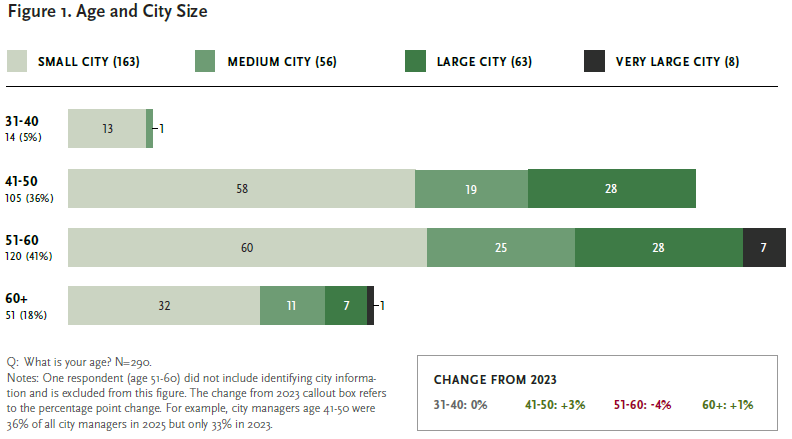
The vast majority of California city managers for whom we have age data are in their forties or fifties. Forty-one percent of respondents are age 51-60 and another 36% are age 41-50. Those who are younger mostly serve in Small or Medium Cities (of the 14 respondents in their thirties, 13 serve in a small city). On the opposite end of the spectrum, managers in the 60+ age bracket also largely serve in Small or Medium Cities (43 of the 51 in that age group). Managers in Large Cities and Very Large Cities are primarily in the 41-50 and 51-60 groups. Of the 63 managers of Large Cities, 28 are 41-50 and 28 are 51-60 years of age. The eight managers of Very Large Cities are overwhelmingly in their fifties (the exception is one manager who is over 61)
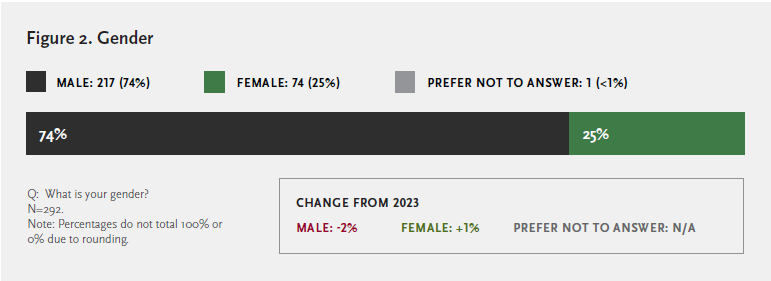
One-quarter of city managers responding to the survey are women and three-quarters are men.
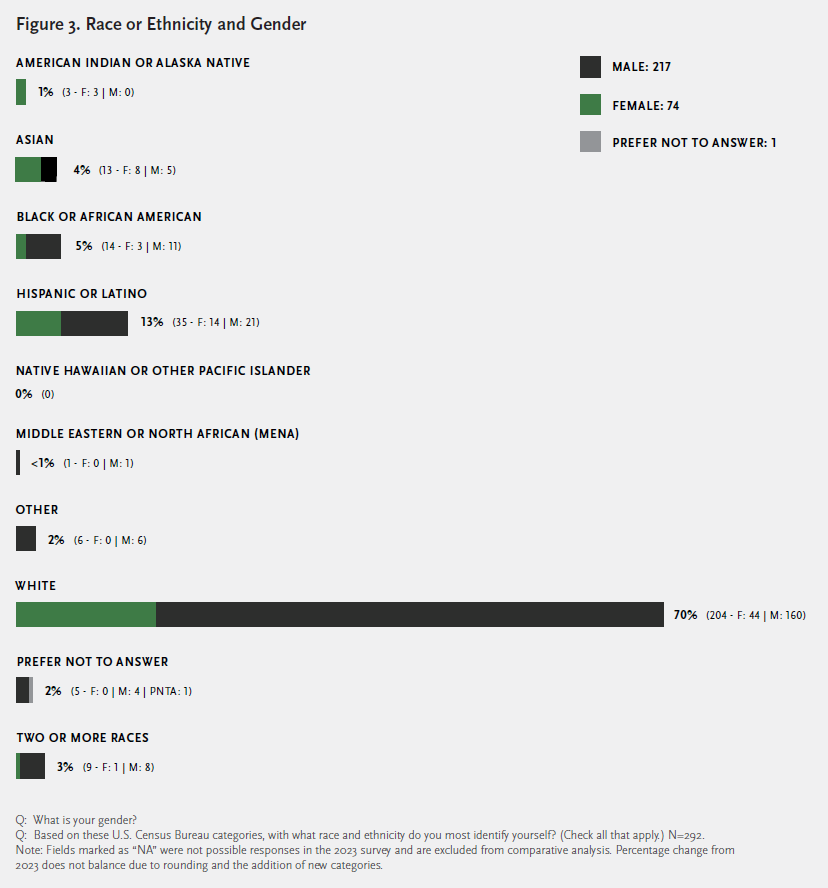
The vast majority of respondents identified as one race or ethnicity: 70% as White, 13% Hispanic or Latino, 4% Asian, 5% Black or African American, 1% American Indian or Alaska Native, and one respondent identified as Middle Eastern or North African. Another 2% identified as Other and 2% preferred not to disclose their race or ethnicity.
Three percent of respondents identified as two or more races. Five of these respondents identified as White and Hispanic or Latino. Three identified as Asian and Other, Asian and White, and White and Other. One respondent identified as three races: White, Hispanic or Latino, and Native Hawaiian or Other Pacific Islander.
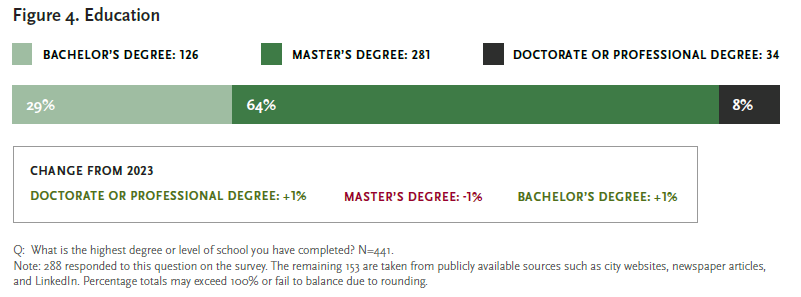
Almost all city managers for whom we were able to get education data have a Bachelor’s degree and almost three-quarters have some form of post-graduate degree. The terminal degree for just over one quarter (29%) is a Bachelor’s degree. The share of city managers with a Master’s-level degree is almost double that, 64%. Another 8% have some form of doctorate-level degree (PhD or JD).
Public policy, public administration, and business administration are the most common fields for Master’s degree holders. A law degree (JD) is the most common degree among doctorate or professional degree holders.
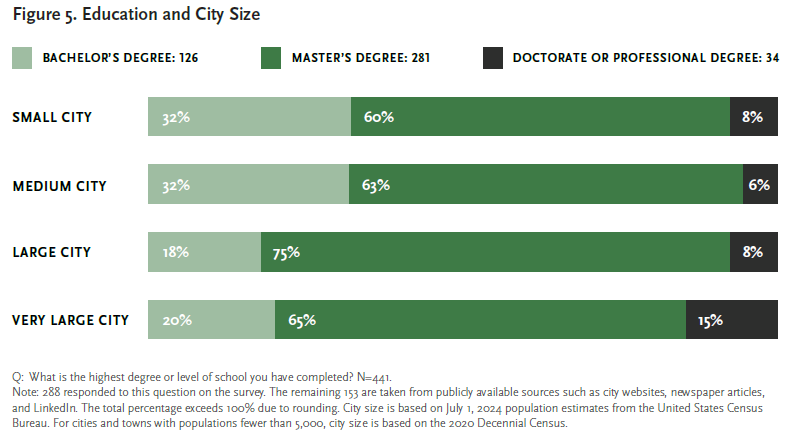
Larger cities tend to have more city managers with graduate degrees. For Small Cities, 68% have a graduate degree (60% Master’s and 8% PhD or JD). For Medium Cities, 69% hold graduate degrees with 63% with Master’s and 6% PhD or JD. For Large Cities, 83% have graduate degrees (75% Master’s and 8% PhD or JD). For Very Large Cities, 80% have graduate degrees (65% Master’s and 15% PhD or JD).
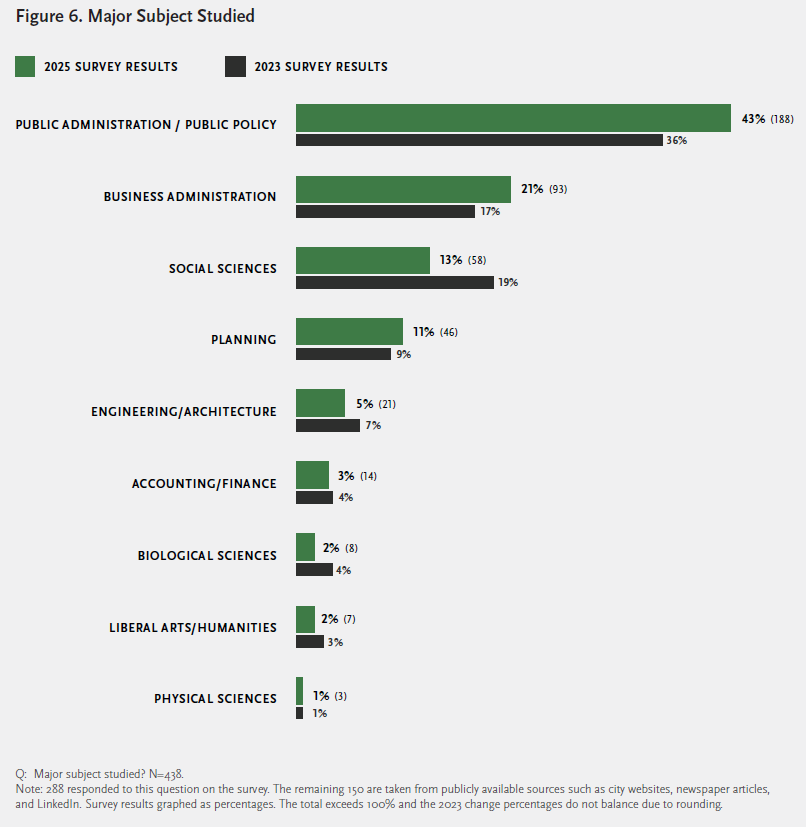
The areas of study among 2025 city managers demonstrate significant shifts in educational background when compared to the 2023 results. Public administration and public policy are the most common subjects of study, accounting for nearly half (43%) of all majors. This figure is the largest increase (7%) from the 2023 Survey. The number of city managers holding degrees in business administration increased by 4% to 21% (of the 93 city managers who hold degrees in business administration, 53 hold MBAs). Meanwhile, other social science subjects decreased by 6% to 13%; this category includes political science, history, and law. Planning, generally urban or regional, increased by 2% to 11%. Only 5% of city managers studied engineering and architecture, a 2% decline.
See Appendix C for a list of fields included in each category.
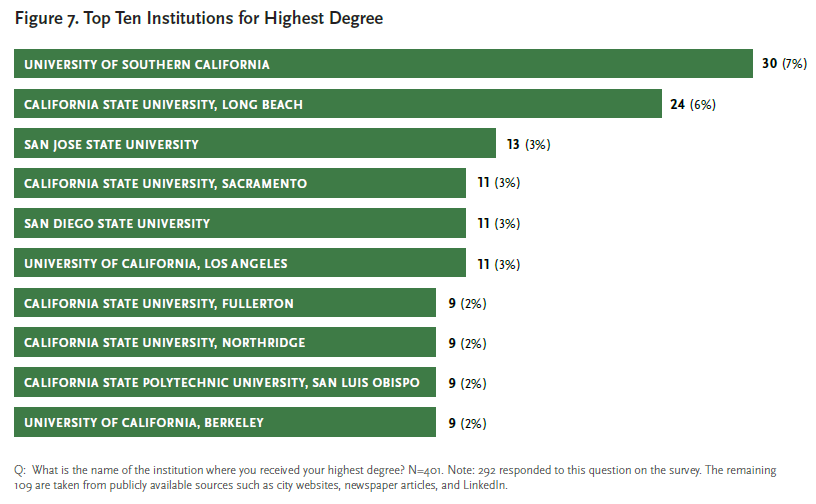
This Survey asked for the first time the institution where city managers earned their highest academic degrees. City managers received their highest degrees from 142 different colleges and universities. The institution that granted the highest degree to the most city managers was the University of Southern California (USC) with 30. All the USC graduates earned advanced degrees and all but three received either a master’s or doctorate degree in Planning or Public Administration. Similarly, of the 24 city managers who received degrees from California State University, Long Beach, all but five received MPP/MPAs. USC is the only private university among the top 15 institutions in this category.
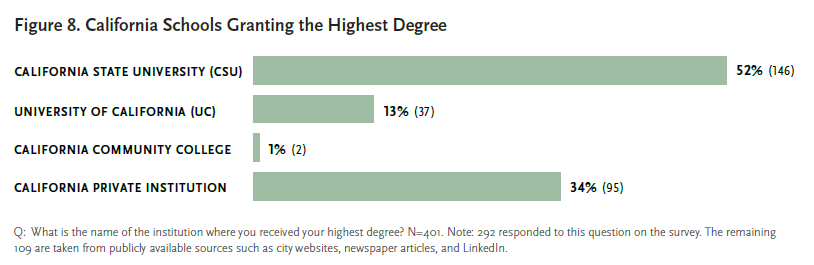
Most respondents (69%) received their highest degree from an academic institution in California. Among California graduates, the majority (66%) received their highest degrees from a public university. Overwhelmingly, city managers received these degrees from a California State University (CSU) campus rather than the University of California (UC) system. Nearly three times as many city managers received their highest degree from a private California institution than from a UC school
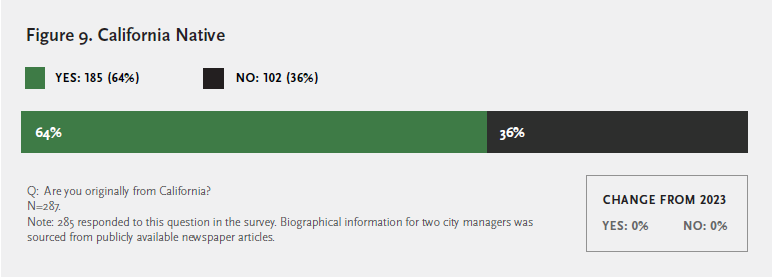
Two-thirds (64%) of responding city managers report that they are originally from California.
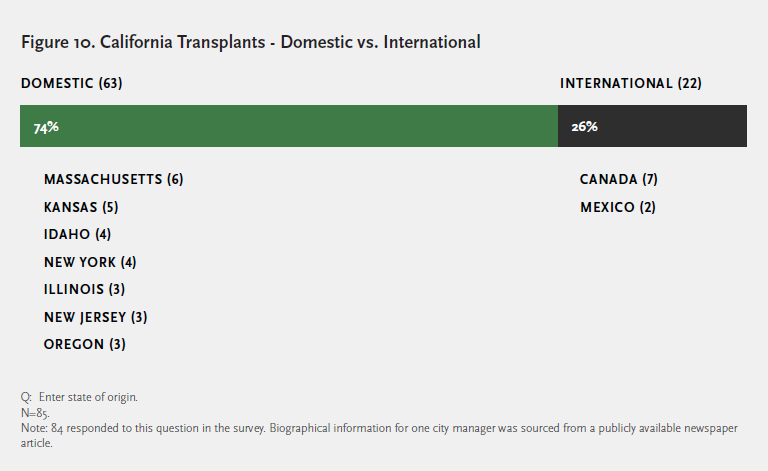
Nearly three-quarters (74%) of responding city managers who migrated to California came from another state, while the rest (26%) came from abroad.
IV. Employment Profile
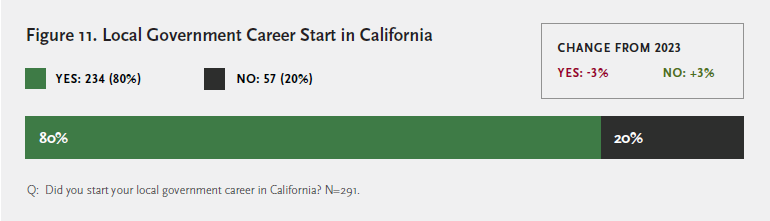
The vast majority of California city managers launched their local government careers in California. Eighty percent got their start here and 20% began their careers outside the state.
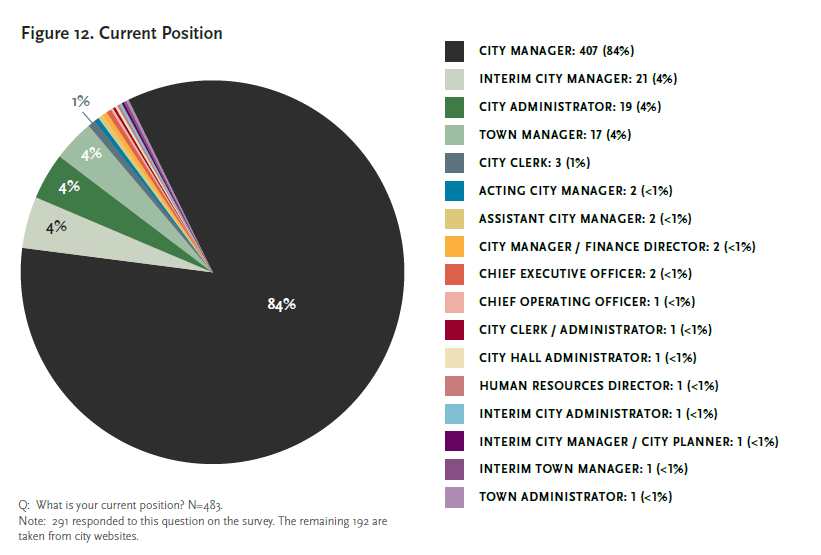
“City manager” is the most common title used for the chief administrative officer in the vast majority of California cities. Of the 483 cities in this study, 435 use a city manager (407 current city managers, 21 interim city managers, 2 acting city managers, 2 assistant city managers, 2 city manager / finance directors, and 1 interim city manager / city planner). “City administrator” is the next most common title (21 cities, including a city clerk / administrator and city hall administrator, or 4% of the total), followed by town manager (18 cities, including 1 interim town manager, or 4% of the total).
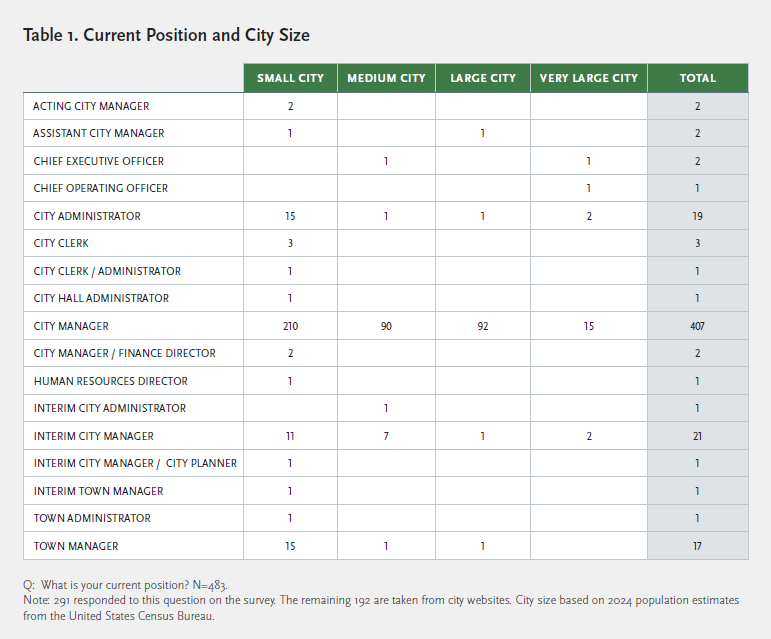
In some small cities, the city clerk acts as the administrative officer. For the strong mayor cities, the elected mayor is the chief executive officer, officially responsible for running all city departments. In all five of these cities, the mayor is, however, assisted by an appointed administrative officer. San Diego has a Chief Operating Officer, Los Angeles has a Chief Executive Officer, and Fresno has a City Manager. Both San Francisco and Oakland have a City Administrator.
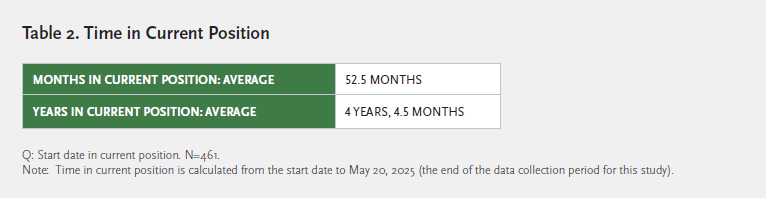
We were able to identify start dates for 461 city managers. They have been in their current positions an average of
52.5 months, or 4 years and 4.5 months.
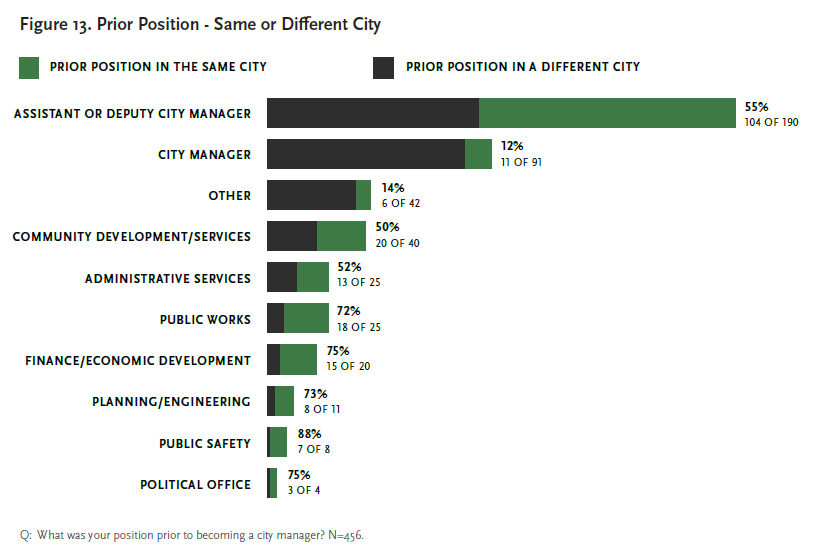
Just under half (45%) of city managers worked for the same city before serving as city manager. Over half (55%) of city managers who previously held the title of assistant or deputy city manager were promoted within their same city to
city manager.
We coded all interim and acting city manager titles as “city managers.” Accordingly, all 11 city managers who previously served as city managers within the same city actually previously held an interim or acting city manager role.
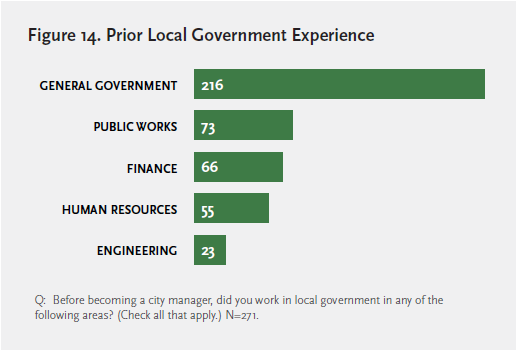
City managers bring a broad range of experience to the position. Over one-quarter of respondents (73 of the 271) reported having prior experience in public works, 66 of the 271 in finance, and 55 of the 271 in human resources. Approximately 8% (23 of the 271) have prior experience in engineering.
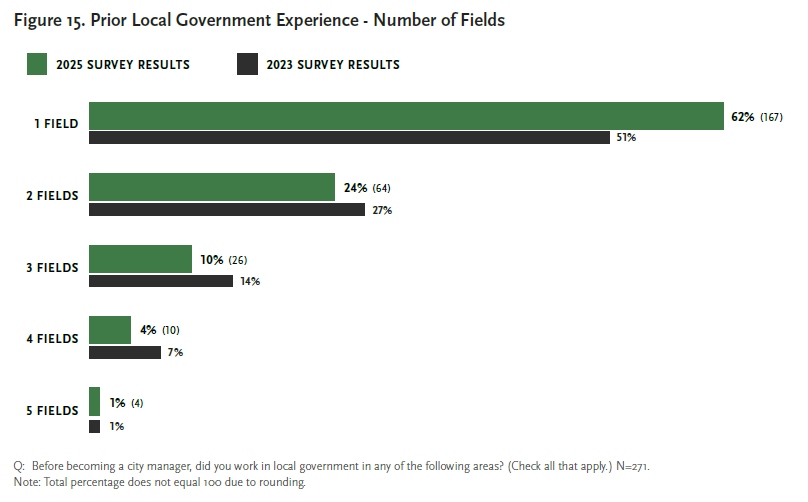
Nearly 40% of respondents reported experience in two or more fields (24% in 2 fields, 10% in three fields, 4% in four fields, and 1% in five fields). The remaining 62% have prior experience in one field. Compared to 2023, far more city managers (11% more) have prior experience in only one field.
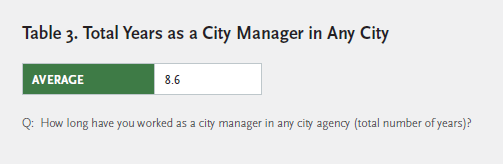
City managers responding to this question have worked an average of 8.6 years as a city manager in one or more cities.
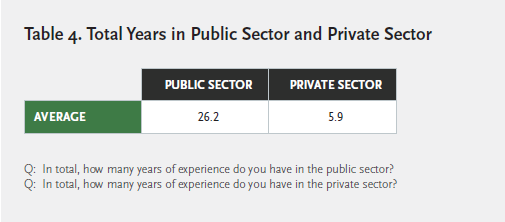
Survey respondents reported an average of 26.2 years of experience in the public sector and an average of 5.9 years of experience in the private sector.
V. City Profile
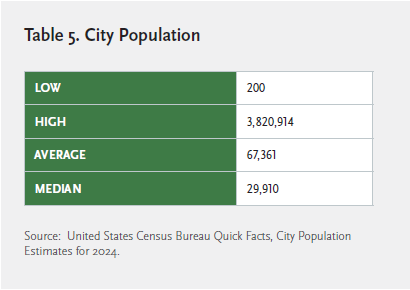
California’s 483 cities range in population from 200 (Amador) to 3,820,914 (Los Angeles) and have an average population of 67,361. The median population is 29,910, meaning that half of the state’s cities are smaller and half are larger.
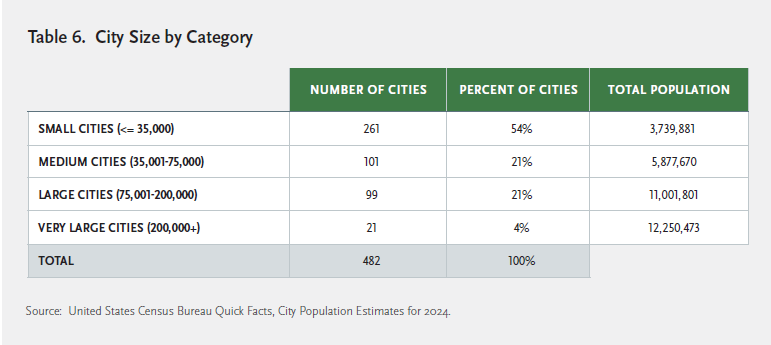
More than half (54%) of California cities are Small, with populations equal to or less than 35,000. Medium Cities, population 35,001 to 75,000, make up 21%, and the average population for California cities (67,361) falls within this category. Large Cities, population 75,001 to 200,000, account for another 21%. Finally, California has 21 Very Large Cities, with populations greater than 200,000. Although Very Large Cities comprise only 4% of all cities in the state, they are home to 32% of California’s 39.5 million residents.9
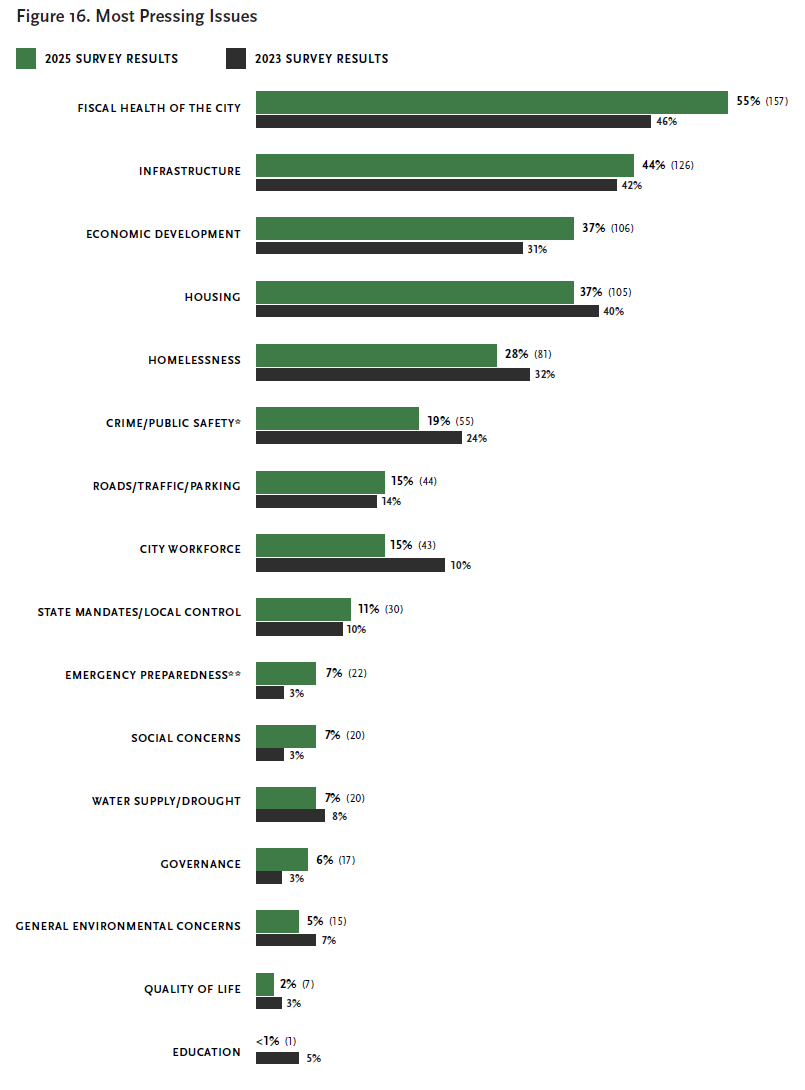
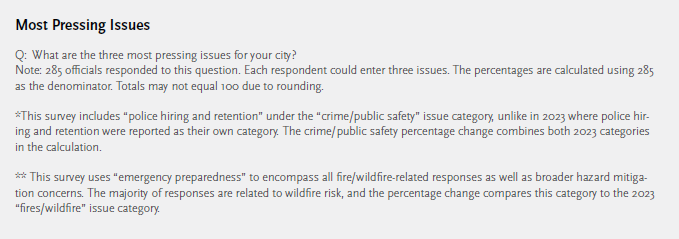
We asked city managers to identify the three most pressing issues facing their cities. Of the 285 responding to this question, more than half (55%) identified the Fiscal Health of the City as a concern. The next four highest concerns are Infrastructure (44%), Economic Development (37%), Housing (37%), and Homelessness (28%). These are followed by Crime and Public Safety (19%), Roads/Traffic/Parking (15%), and City Workforce issues (15%).
Compared to 2023, city managers share the same top two concerns – fiscal and infrastructure issues – and these concerns have only grown more pronounced. Significantly, concerns regarding the fiscal health of cities and economic development grew sharply (9% and 6% respectively).
City managers for several cities affected by or in close proximity to recent wildfires listed wildfire preparedness and mitigation as a top priority, and emergency preparedness concerns grew by 4%. Similarly, social concerns increased by 4%, with several city managers listing the state of civil discourse and a lack of public trust in government as top issues.
Concerns regarding City Workforce (-7%), Crime/Public Safety (-5%), and Education (-5%) issues decreased the most. Notably, only one respondent listed education as a pressing issue in 2025.
The rare mention of education as a pressing issue probably reflects the fact that in general city managers have little control over local public education, which is directed by popularly elected local school boards.
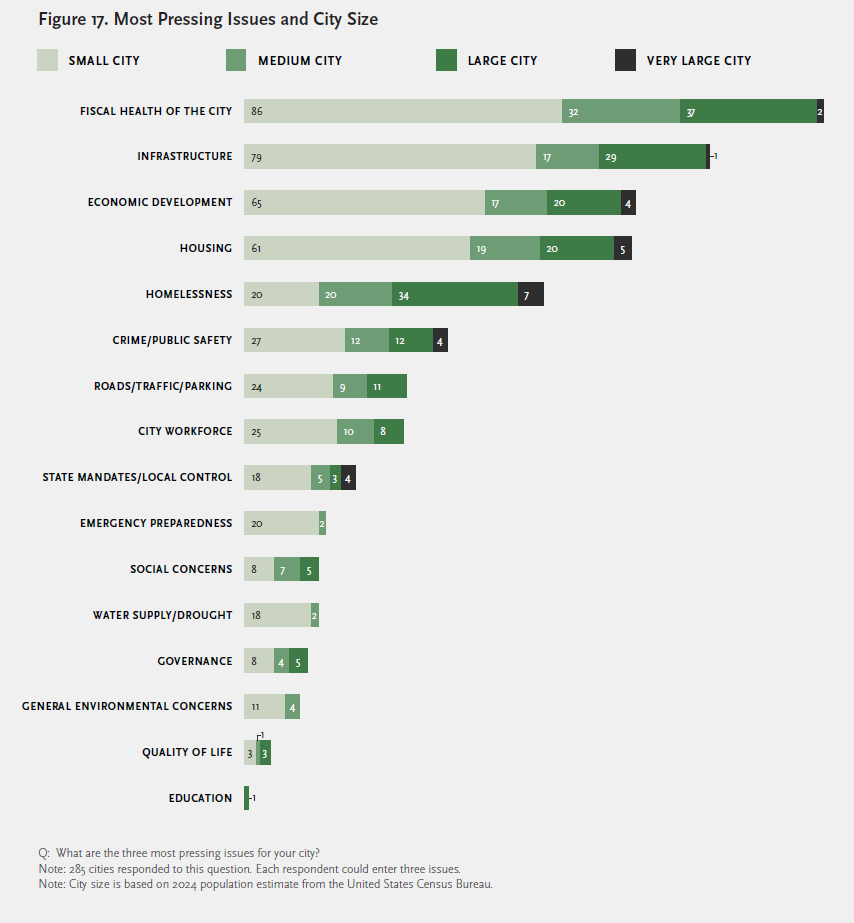
It is interesting to note that there is some variation on the three most pressing issues based on city size. The 157 cities reporting pressing concerns about the Fiscal Health of the City are dominated by 86 Small Cities, then 32 Medium Cities, and 37 Large Cities. Only two Very Large Cities list Fiscal Health as one of their three most pressing concerns. Relative to Large and Very Large, Small Cities are far more concerned about Emergency Preparedness (20 of 22) and Water Supply/Drought (18 of 20).
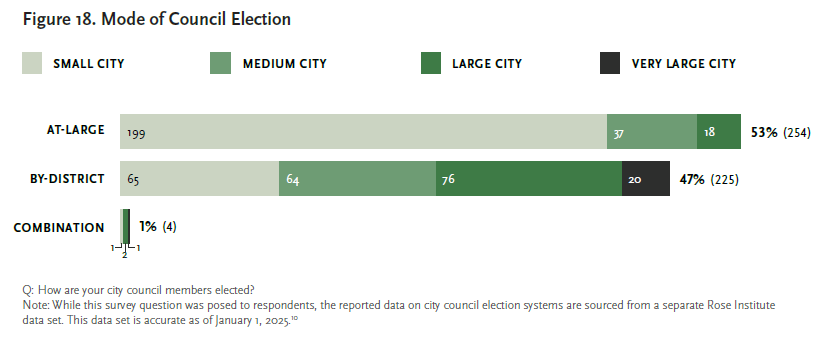
Fifty-three percent of California cities elect councils using at-large election systems, where council members are elected to represent the entire city. After the California Voting Rights Act of 2001 (CVRA), an increasing number of California cities have transitioned to by-district elections, where council members represent geographic districts within a city. As of April 30, 2025, 47% of California cities use by-district elections. Another 1% use a mixed system with some members elected by-districts and some at-large.
By-district or combination councils are increasingly common in larger cities. All Very Large Cities use district-based elections. One very large city (Oakland) uses a hybrid by-district and at-large system.
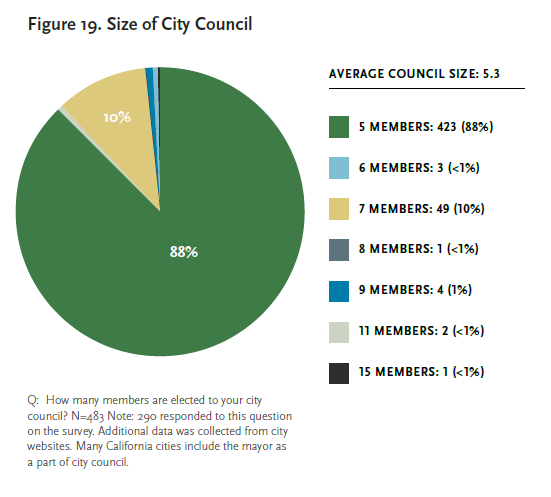
The 5-member city council is the default under California law11 and the vast majority (88%) of city councils in California are that size. Charter cities have the authority to deviate from the default as part of their charter. Los Angeles has the largest city council with 15 members.
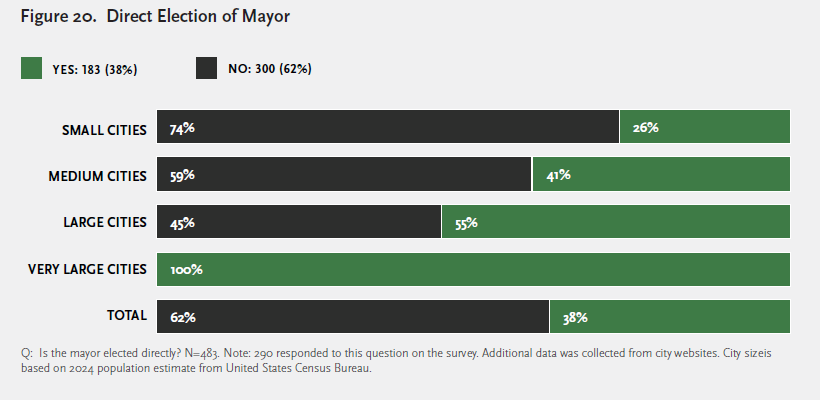
Almost two-fifths (38%) of the cities in California elect a mayor directly; 62% do not. Direct election is more common in larger cities. Among Small Cities, only 26% directly elect their mayor. This rises to 41% for Medium Cities and 55% for Large Cities. All Very Large Cities in California directly elect mayors.
VI. Conclusion
This second Survey of California’s City Managers further advances our understanding of this important group of local officials. The 2025 Survey confirms several findings from the 2023 Survey while also highlighting some changes. Notably, as envisioned by the Progressive Era reformers of the early twentieth century, California’s City Managers are highly professionalized. Nearly three quarters have earned advanced academic degrees, many in the fields of public policy, public administration, or business administration. For the first time, this Survey identifies the educational institutions where California’s City Managers received their highest degrees, led by the University of Southern California, Cal State Long Beach, several other campuses of the Cal State University system, UCLA, and UC Berkeley. The Survey also shows that City Managers possess other attributes of professionalization, including extensive prior experience in local government before attaining their positions and relatively long tenures in office, having currently served, on average, nearly nine years as a city manager in one or more cities.
The demographic profile of the profession is largely unchanged since the prior Survey in 2023, an understandable finding given the relatively short time span between the two Surveys.
A large majority (approximately three-fourths) of California’s City Managers responding to the 2025 Survey identified as white and three-fourths as male. With respect to age, most City Managers (77%) are in their forties or fifties, with a slight uptick in the percentage in their forties (now 36%) and a corresponding decrease in the percentage in their fifties (41%).
Finally, City Managers face a long list of challenges, but ranked the same five issues as “most pressing” in 2025 as two years before: the fiscal health of the city, infrastructure, economic development, housing, and homelessness, with economic development rising from fifth to third in the ranking in 2025.
VII. References
Bollens, John C. Appointed Executive Local Government, Los Angeles: Haynes Foundation, 1952, 1.
Cal. Gov. Code § 34851 (2022) https://leginfo.legislature.ca.gov/faces/codes_displayText.xhtml?lawCode=GOV&division=2.&title=4.&part=1.&chapter=4.&article=1.
Cal. Gov. Code § 36501 (2022). https://leginfo.legislature.ca.gov/faces/codes_displaySection.xhtml?sectionNum=36501.&lawCode=GOV.
Greene, Rich. “Carolyn Steffan Honored for 50 Years of Dedicated Service.” Red Bluff Daily News, April 11, 2015, updated May 16, 2018. https://www.redbluffdailynews.com/2015/04/11/carolyn-steffan-honored-for-50-years-of-dedicated-service/.
Hamilton, Randy H. “Ukiah, 1904: A Modest Footnote to the History of the Council-Manager Form of Municipal Government in the United States,” Berkeley, CA: U.C. Berkeley Institute of Governmental Studies Working Paper 89-2, March 1989: 1-8.
Heidorn, Nicolas. California Municipal Democracy Index 2016. Sacramento, CA: California Common Cause. December 2016. https://www.commoncause.org/wp-content/uploads/legacy/states/california/research-and-reports/california-municipal-key-findings.pdf.
International City/County Management Association. 2018 Municipal Form of Government Survey – Summary of Survey Results. Washington, DC: ICMA, 2019, 1, https://icma.org/sites/default/files/2018%20Municipal%20Form%20of%20Government%20Survey%20Report.pdf.
Mason, Haven A. “A Profession of Municipal Management,” California Municipalities, August 1899, reprinted in Richard J. Stillman II, The Rise of the City Manager: A Public Professional in Local Government. Albuquerque: University of New Mexico Press, 1974: 117-119.
Stillman, Richard J., II. The Rise of the City Manager: A Public Professional in Local Government. Albuquerque: University of New Mexico Press, 1974): 117-119.
U.S. Census Bureau. “Population Estimates, July 1, 2024 (V2021),” Quick Facts. Accessed April 14, 2025. https://www.census.gov/quickfacts/fact/table/US/PST045222.
U.S. Census Bureau. “Total Population.” Decennial Census, Table P1, 2020. Accessed May 1, 2025. https://data.census.gov/.
van Wingerden, Pieter K. and Aria Fafat. Mapping the Revolution in California City Council Election Systems. Claremont, CA: Rose Institute of State and Local Government: April 30, 2025, https://roseinstitute.org/wp-content/uploads/2025/05/CA-City-Elections-Systems-Report_FINAL.pdf.
VIII. Appendices
Appendix A - Survey Instrument