Faculty and Student Engagement with Technology at Claremont McKenna
Note: This report was originally presented at the Strategic Educational Technology Summit, April 11, 2014. The schedule is available of speakers and what was discussed.
Executive Summary
To provide recent data on the use of technology by Claremont McKenna College faculty, Information Technology Services (ITS) invited all faculty to participate in a survey this past month, yielding 89 completed responses. Our most recent student survey conducted last spring yielded 613 respondents. While statistical data are helpful and the excellent response rate adds to the validity of our data, individual comments often provide insight into how our constituents feel about technology at CMC, and we have thus included excerpts, specifically in the faculty session.
Key Faculty Findings
-
43% of the faculty members are very satisfied with the technology support they have received from ITS and an additional 37.5% are satisfied with the technology support they have received from ITS.
-
56% of faculty members feel that technology is essential to success in their classes and an additional 31% feel that technology can be a useful tool that they encourage students to use.
-
67% of faculty members always use Sakai (our learning management system) in their teaching and an additional 18% use Sakai on a semi-regular basis; only 12 of 89 faculty reported “never” using Sakai.
-
78% of faculty members feel that Sakai is easy or very easy to use.
-
37% of faculty members would recommend that the College switch to a course management system other than Sakai.
Key Student Findings
-
98% of students own a computer.
-
60% of students are now Mac users, up from just 14% in 2004.
-
96% of students were able to get their computers up and running on the internet in their residence halls with little or no assistance.
-
12% of students own printers, down from much larger percentages due to improved printing capabilities in the labs.
-
81% of students own a smart phone, with iPhone at 52%; Blackberry at 8%; Android 19%; and Windows 1% and others at 1%.
Table of Contents
Faculty Survey Results
Which department are you affiliated with at CMC?
Overall, how satisfied are you with the help you’ve received from ITS?
How many years have you been teaching at CMC?
What is your preferred computing platform?
How do you feel about using technology as a teaching/learning tool?
Which of the following technologies do you currently use for course-related activities?
Usage and interest in technologies and online tools
How frequently do you contact ITS for support or assistance with technology?
In your classroom, is the classroom technology functioning properly?
Which is your preferred method for contacting students?
How frequently do you use Sakai for your courses?
Please rate the following features of Sakai.
Please indicate your agreement with the following statements about Sakai.
Would you recommend that the College look into an alternative learning management system other than Sakai?
Student Survey Results
Computer ownership
Laptop ownership
Apple ownership
Student network connection
Lab usage
Campus storage drives
Printing
What students rate as important
How students rate their own competence with technology
Top software applications
Student expectations of technology use in the classroom
Faculty Survey Results
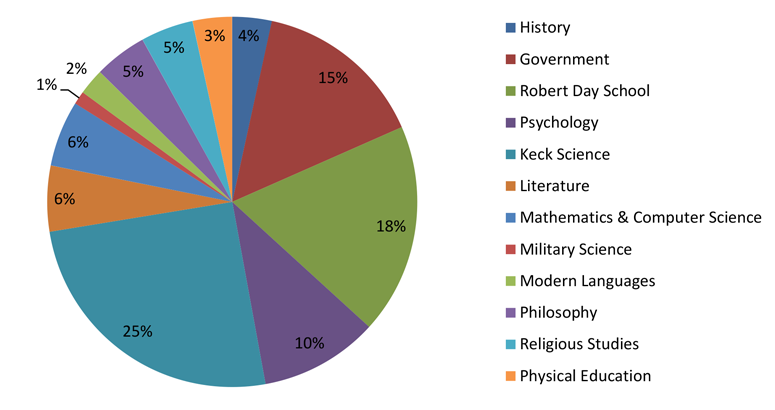
1. Which department are you affiliated with at CMC?
(Answer Option / Response Percent / Response Count)
History / 3.40% / 3
Government / 14.90% / 13
Robert Day School of Economics & Finance / 18.40% / 16
Psychology / 10.30% / 9
Keck Science / 25.30% / 22
Literature / 5.70% / 5
Mathematics & Computer Science / 5.70% / 5
Military Science / 1.10% / 1
Modern Languages & Literatures / 2.30% / 2
Philosophy / 4.60% / 4
Religious Studies / 4.60% / 4
Physical Education & Athletics / 3.40% / 3
Answered question: 87
Skipped question: 2
2. Overall, how satisfied are you with the help you’ve received from ITS?
(VS=Very Satisfied / S=Satisfied / N=Neutral / D=Dissatisfied / VD=Very Dissatisfied / RC=Response Count)
Government / VS-7 / S-5 / N-0 / D-0 / VD-1 / RC-13
History / VS-2 / S-0 / N-0 / D-1 / VD-0 / RC-3
Keck Science / VS-5 / S-8 / N-6 / D-1 / VD-2 / RC-22
Literature / VS-3 / S-1 / N-0 / D0 / VD-1 / RC-5
Math/Comp Sci / VS-2 / S-3 / N-0 / D-0 / VD-0 / RC-5
Military Science / VS-0 / S-1 / N-0 / D-0 / VD-0 / RC-1
Modern Languages / VS-0 / S-2 / N-0 / D-0 / VD-0 / RC-2
Philosophy / VS-1 / S-1 / N-1 / D-1 / VD-0 / RC-4
Physical Education / VS-3 / S-0 / N-0 / D-0 / VD-0 / RC-3
Psychology / VS-6 / S-3 / N-0 / D-0 / VD-0 / RC-9
Religious Studies / VS-3 / S-1 / N-0 / D-0 / VD-0 / RC-4
RDS / VS-6 / S-7 / N-2 / D-0 / VD-1 / RC-16
Unknown / VS-0 / S-1 / N-0 / D-0 / VD-0 / RC-1
Answered question / VS-38 / S-33 / N-9 / D-3 / VD-5 / RC-88
Percentages / VS-43.18% / S-37.50% / N-10.23% / D-3.41% / VD-5.68%
3. How many years have you been teaching at CMC?
(Answer Option / Response Percent / Response Count)
1 year or less / 15.90% / 14
2-5 years / 25.00% / 22
6-10 years / 21.60% / 19
11-20 years / 17.00% / 15
21-30 years / 13.60% / 12
More than 30 years / 6.80% / 6
Answered question: 88
Skipped question: 1
4. What is your preferred computing platform?
(Answer Option / Response Percent / Response Count)
Windows / 60.20% / 53
Macintosh / 25.00% / 22
6-10 years / 36.40% / 32
Other (please specify) / 3.40% / 3
Answered question: 88
Skipped question: 1
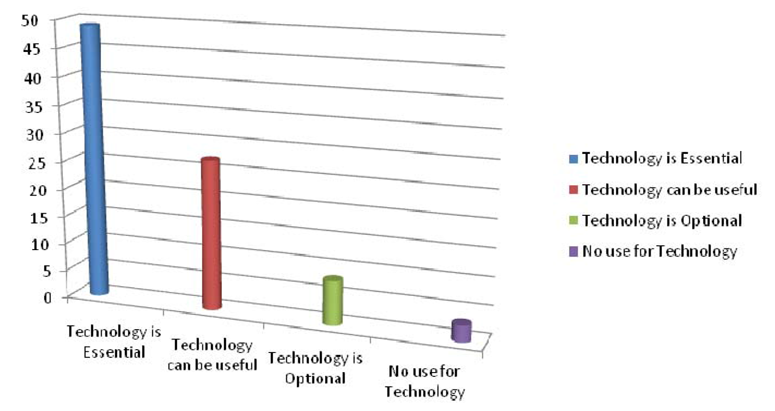
5. How do you feel about using technology as a teaching/learning tool?
(Answer Option / Response Percent / Response Count)
Technology is essential to success in my classes / 56.30% / 49
Technology can be a useful tool and I encourage students to use it / 31.00% / 27
Technology is optional in my class / 9.20% / 8
I have no use for technology in my class / 3.40% / 3
Answered question: 87
Skipped question: 2
6. I currently use the following technologies for my course-related activities (choose all that apply):
(N=Never / S=Several times a semester / W=Several times a week / A=Always / D=Almost Daily / RC=Response Count)
Sakai / N-12 / S-13 / W-21 / A-12 / D-29 / RC-87
My own website / N-51 / S-12 / W-7 / A-4 / D-7 / RC-81
CMC Portal / N-12 / S-34 / W-23 / A-7 / D-10 / RC-86
Video conferencing, web-conferencing / N-63 / S-16 / W-4 / A-2 / D-1 / RC-86
E-books / N-56 / S-12 / W-5 / A-7 / D-3 / RC-83
Lecture-capture / N-79 / S-3 / W-1 / A-0 / D-0 / RC-83
MOOCs (Massive Open Online Courses) / N-78 / S-7 / W-0 / A-0 / D-0 / RC-85
Powerpoint, Prezi / N-14 / S-22 / W-16 / A-15 / D-20 / RC-87
Skype, Google Chat / N-52 / S-19 / W-6 / A-4 / D-3 / RC-84
Clickers / N-71 / S-4 / W-4 / A-0 / D-5 / RC-84
Tablets, iPads / N-59 / S-7 / W-5 / A-3 / D-9 / RC-83
GIS / N-72 / S-5 / W-1 / A-1 / D-1 / RC-80
Streaming video, in-class video / N-30 / S-31 / W-10 / A-5 / D-7 / RC-83
Classroom document cameras / N-71 / S-7 / W-2 / A-2 / D-1 / RC-83
Other (please specify) RC-17
Answered question: 88
Skipped question: 1
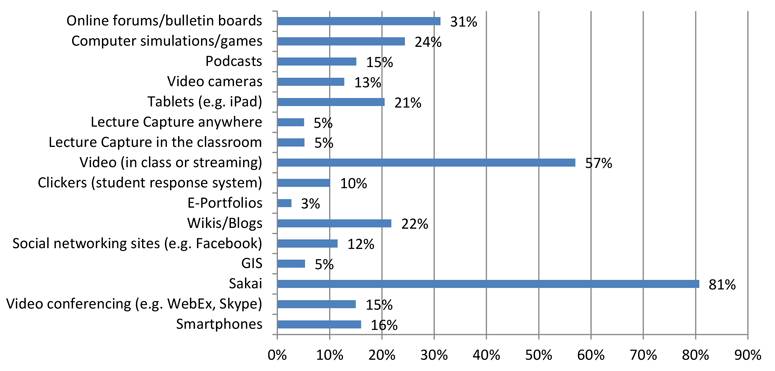
7. For each of the following technologies/online tools, please choose the option most relevant to you:
(Y=I use this now with my students / M=I would like to learn more about this / N=I see no relevance to my courses / RC=Response Count)
Smartphones / Y-13 / M-17 / N-51 / RC-81
Video conferencing / Y-12 / M-19 / N-49 / RC-80
Sakai / Y-67 / M-5 / N-11 / RC-83
GIS / Y-4 / M-22 / N-50 / RC-76
Social networking sites / Y-9 / M-9 / N-60 / RC-78
Wikis, blogs / Y-17 / M-29 / N-32 / RC-78
E-portfolios / Y-2 / M-31 / N-42 / RC-75
Clickers / Y-8 / M-30 / N-41 / RC-79
Video (in-class or streaming) / Y-45 / M-11 / N-23 / RC-79
Lecture capture in the classroom / Y-4 / M-33 / N-40 / RC-77
Lecture capture anywhere / Y-4 / M-35 / N-39 / RC-78
Tablets / Y-16 / M-27 / N-35 / RC-78
Video cameras / Y-10 / M-19 / N-49 / RC-78
Podcasts / Y-11 / M-27 / N-32 / RC-78
Computer simulations, games / Y-19 / M-27 / N-32 / RC-78
Online forums, bulletin boards / Y-24 / M-27 / N-26 / RC-77
Answered question: 87
Skipped question: 2
8. How frequently do you contact ITS for support or assistance with technology?
(Answer Option / Response Percent / Response Count)
Weekly / 5.70% / 5
Monthly / 48.30% / 42
1-2 times per semester / 28.70% / 25
1-2 times per year / 17.20% / 15
Never / 0.00% / 0
Answered question: 87
Skipped question: 2
9. In your classroom, is the classroom technology (projector, teacher station, sound) functioning properly?
(Answer Option / Response Percent / Response Count)
Always / 24.10% / 21
Usually / 62.10% / 54
Rarely / 4.60% / 4
Don't use classroom technology / 9.20% / 8
Answered question: 87
Skipped question: 2
10. Which is your preferred method for contacting students? Select all that apply:
(Answer Option / Response Percent / Response Count)
Email / 89.80% / 79
Sakai / 55.70% / 49
CMC Portal / 25.00% / 22
Telephone / 8.00% / 7
Other / 4.50% / 4
Answered question: 88
Skipped question: 1
11. How frequently do you use Sakai for your courses?
(Answer Option / Response Percent / Response Count)
Always / 67.00% / 59
On a semi-regular basis / 18.20% / 16
Never / 14.80% / 13
Answered question: 88
Skipped question: 1
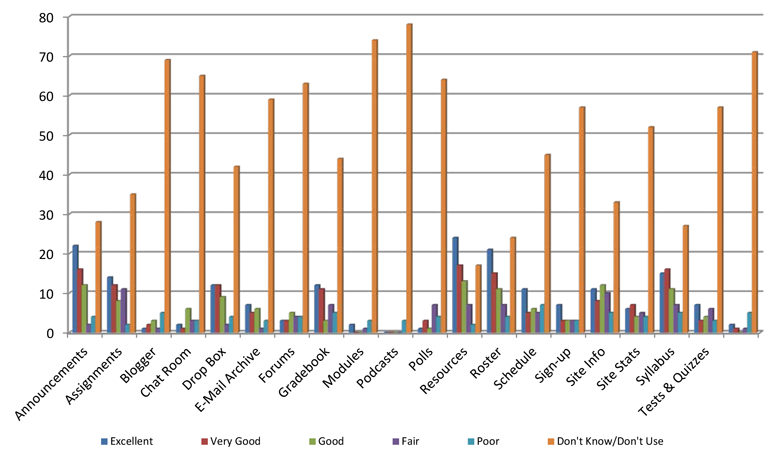
12. Please rate the following features of Sakai:
(E=Excellent / VG=Very Good / G=Good / F=Fair / P=Poor / NA=Don't Know, Don't Use / RC=Response Count)
Announcements / E-22 / VG-16 / G-12 / F-2 / P-4 / NA-28 / RC-84
Assignments / E-14 / VG-12 / G-8 / F-11 / P-2 / NA-35 / RC-82
Blogger / E-1 / VG-2 / G-3 / F-1 / P-5 / NA-69 / RC-81
Chat Room / E-2 / VG-1 / G-6 / F-3 / P-3 / NA-65 / RC-80
Drop Box / E-12 / VG-12 / G-9 / F-2 / P-4 / NA-42 / RC-81
E-Mail Archive / E-7 / VG-5 / G-6 / F-1 / P-3 / NA-74 / RC-80
Forums / E-3 / VG-3 / G-5 / F-4 / P-4 / NA-63 / RC-82
Gradebook / E-12 / VG-11 / G-3 / F-7 / P-5 / NA-44 / RC-82
Modules / E-2 / VG-0 / G-0 / F-1 / P-3 / NA-74 / RC-80
Podcasts / E-0 / VG-0 / G-0 / F-0 / P-3 / NA-78 / RC-81
Polls / E-1 / VG-3 / G-1 / F-7 / P-4 / NA-64 / RC-80
Resources / E-24 / VG-17 / G-13 / F-7 / P-2 / NA-17 / RC-80
Roster / E-21 / VG-15 / G-11 / F-7 / P-4 / NA-24 / RC-82
Schedule / E-11 / VG-5 / G-6 / F-6 / P-7 / NA-45 / RC-79
Sign-up / E-7 / VG-4 / G-4 / F-4 / P-4 / NA-57 / RC-76
Site Info / E-11 / VG-8 / G-12 / F-10 / P-5 / NA-33 / RC-79
Site Stats / E-6 / VG-7 / G-4 / F-5 / P-4 / NA-52 / RC-78
Syllabus / E-15 / VG-16 / G-11 / F-7 / P-5 / NA-27 / RC-81
Tests & Quizzes / E-7 / VG-3 / G-4 / F-6 / P-3 / NA-57 / RC-80
Wiki / E-2 / VG-1 / G-0 / F-1 / P-5 / NA-71 / RC-80
Answered question: 85
Skipped question: 4
13. Please indicate your agreement with the following statements:
(SA=Strongly Agree / A=Agree / U=Unsure / D=Disagree / SD=Strongly Disagree / NA=Not Applicable / RC=Response Count)
I feel that Sakai is easy to use / SA-19 / A-37 / U-4 / D-11 / SD-4 / NA-10 / RC-85
Overall I am satisfied with my experience of using Sakai / SA-13 / A-40 / U-5 / D-13 / SD-5 / NA-9 / RC-85
I am satisfied with the support by the ITS staff that is available to assist me with Sakai / SA-24 / A-28 / U-5 / D-4 / SD-3 / NA-19 / RC-83
Answered question: 85
Skipped question: 4
14. Would you recommend that the College look into an alternative learning management system other than Sakai?
(Answer Option / Response Percent / Response Count)
Yes / 36.60% / 26
No / 63.40% / 45
Answered question: 71
Skipped question: 18
Student Survey Results
Information Technology Services has been gathering longitudinal data for the purpose of gauging student perception and use of online technologies in the classroom over a period of years. Survey results have helped guide ITS in several ways. As just one example, the expansion of Macintosh users and student concerns about ease of printing have led us to implement EveryonePrint, a web printing portal that better supports our Macintosh users.
The following statistics are unadjusted and based on summary reporting only from the following surveys:
(Date of Survey / Number Responding)
October 2004 / 696
September 2006 / 650
September 2007 / 596
March 2009 / 659
February 2010 / 665
February 2011 / 666
March 2012 / 613
ITS has consistently received extremely high return rates for surveys, at over 50% and at times approaching 60% of the campus as a whole. Certain demographics are under-represented, including off-campus students.
Here are collected highlights assembled from the surveys:
1. Computer ownership remains at saturation levels – between 98.5% and 99.2% reporting ownership, well within any margin of error from year to year. While this means CMC does have a few students who do not own computers at the time of the survey, they are a supportable subgroup via the labs.
2. Laptop ownership has risen from just over 85% in 2004 to 98% in 2012. This is well above ECAR’s reporting of 83% of undergraduate students owning a laptop1. However, desktop ownership still remains at approximately 5.5%. There is a significant “overlap” group that owns both a laptop and a desktop.
3. Apple ownership has risen significantly, from just 14% in 2004 to approximately 60% in 2012.
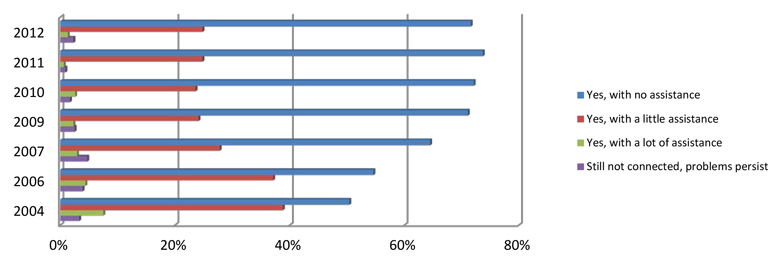
4. The rate and ease of student connection to the network and to the Internet has been rising, due to improved partnership between our Student Services and Networking Systems staff. The number of students able to connect to the network either with no assistance or with little assistance has risen from 89% in 2004 to the high 90s.
5. Lab usage remains at or near full capacity for much of the year. However, only 43.7% of students report using the labs for group projects in 2012, the lowest number since 2007, the first year we began asking this question: 2007, 38.3%; 2009, 55.2%; 2010, 53.5%; 2011, 48.1%. We surmise with the opening of additional wireless enabled network spaces, such as Kravis, and the return to student use of Bauer’s popular Crocker Reading Room, students have dispersed to take advantage of less crowded locations.
6. There has been a continuing downward trend of students using the campus storage drives from their rooms. 2004, 53%; 2006, 43%; 2007, 33%; 2009, 35%; 2010, 38%; 2011, 32%; 2012, 27%. We attribute this to our rollout of Google Docs for students in 2007, which corresponds to the large drop in use of campus storage drives. Students began using Google Docs (now Drive) and requesting information and workshops regarding collaborative work using Google Docs. Student Technology Services began noticing a rising need to support conversion of Google Docs to formats compatible with Microsoft Office. After 2010, Dropbox became a larger presence on campus, both as an employer (through Career Services) and as a general trend.
7. CMC offers free printing to students. Student printer ownership continues to decline: 2004, 47%; 2006, 40%; 2007, 44%; 2009, 40%; 2010, 33%; 2011, 28%; 2012, 25%. CMC also provides “Print Only” workstations to help ease congestion in the labs.
8. We ask a question “How important to you are the following” on a scale of 0 to 5, with 0 as Unimportant and 5 as Very Important. It has been interesting to see some of the changes over the years:
a. In 2004, the most important feature to students, was Access to the Internet at an average rating of 4.92. While this remains the #1 choice, the number of students rating it a “5” has actually dropped from over 95%, to just over 91% in 2011.
b. Speed of Internet Access (4.8/5 average) – This is the consistent #2 choice.
c. Free Printing (as opposed to a quota) (4.74/5 average) – This is the consistent #3 choice, always .04-.06 points behind #2.
d. Wireless Access in Public Areas (4.72/5) – this has risen from outside the top 5 and a rating of 4.3 up to #4 and 4.7. Students rate wireless access in public areas higher than wireless access in dorm rooms or in classes. This may be due to their having the option to use wired access from their dorm.
e. Computer Labs Always Available (4.53/5) – this is a newcomer to the top 5, beating out Wireless Access in Dorm Rooms (last year’s number 5), however, it has consistently garnered 4.4-4.5 points each year.
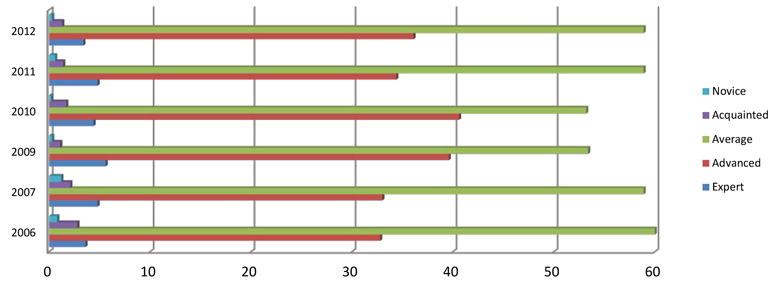
9. One interesting note is how students rate their own competence in technology. We asked, “How would you rate yourself technologically?” We give them 5 choices:
a. Expert (I INVENTED the Internet)
b. Advanced (I know WHO invented the Internet)
c. Average (I know what the Internet is)
d. Acquainted (Internet? That’s where music is, right?)
e. Novice (Where’s the “Any” key?)
We expected to see the number of those reporting “Expert” or “Advanced” to rise over time since the resulting generations are supposedly becoming more and more technological adept and familiar, but results do not support this.
10. The types of software applications students use is fairly stable, with word processing, spreadsheets, and presentation software firmly in the lead.
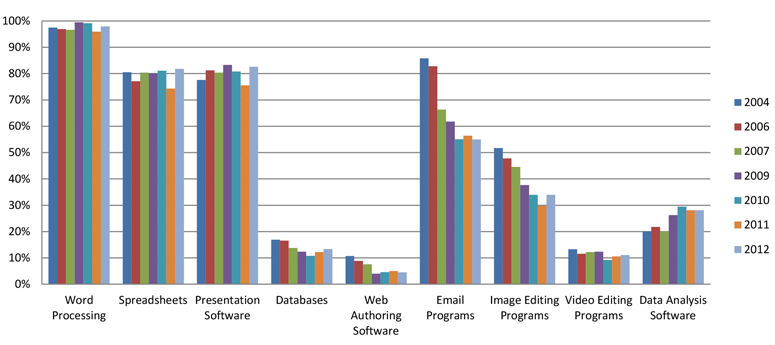
a. A notable statistic is that reported use of data analysis software (e.g. STATA, SPSS, Maple) underwent a rise from 20% early on and has remained steady at just over 28%, indicating faculty are using this type of software in their classes when relevant.
b. Image editing (Photoshop) and video editing software use remains at minimal to low levels.
Since beginning our surveys in 2004, we have asked if students’ high school experience included their teachers using computers in class. Beginning in 2009, we also asked them to estimate how many hours on a weekly basis. Computer usage in high school teaching seems to be rising.
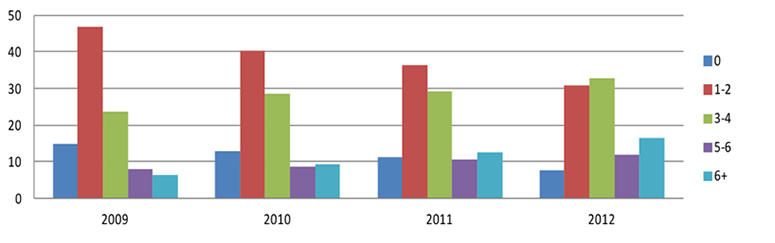
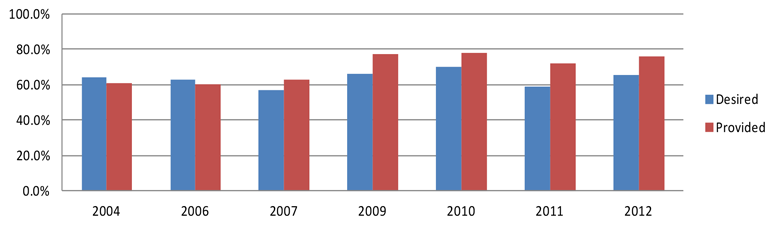
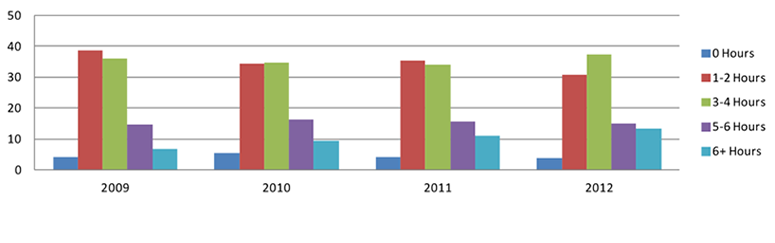
11. In response to the question, “Prior to arriving at CMC, how often did you EXPECT your CMC instructors to use computers in their teaching on a weekly basis?”
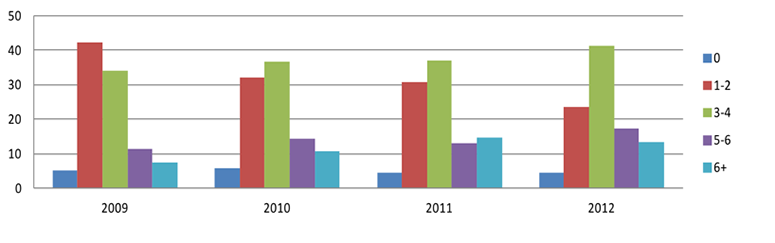
12. We also asked students to comment on the actual usage of computers by instructors in class.
12. Students were asked to comment on what technologies faculty have used in their classes, and what technologies they would like faculty to use.
a. Faculty use of technology seems to be rising.
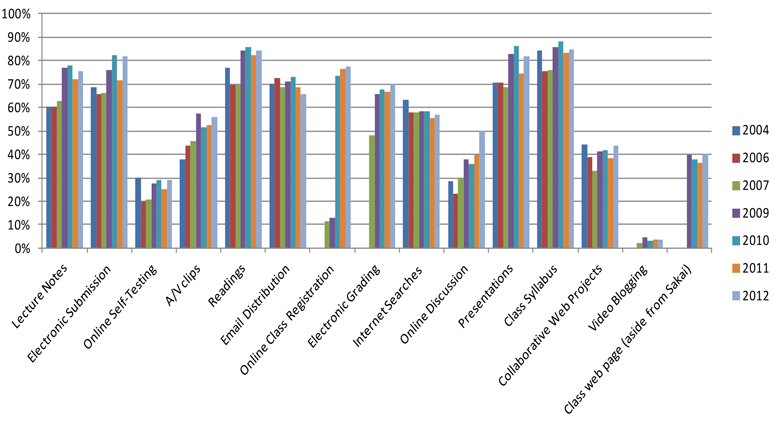
b. Student desires seem to remain stable from year to year:
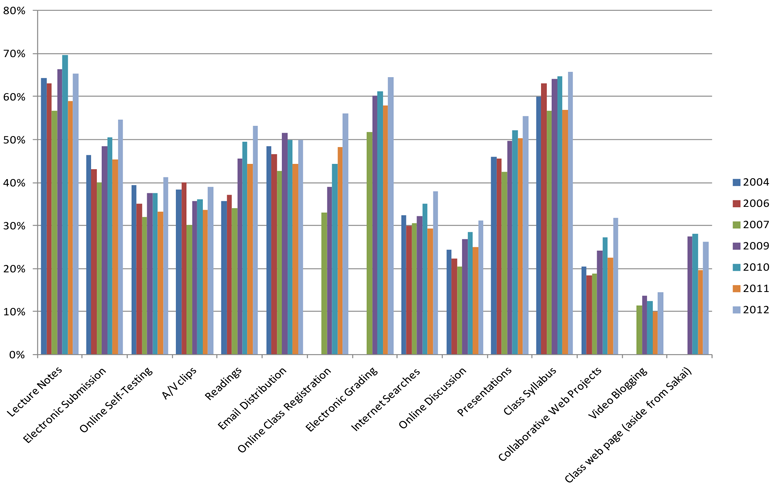
c. Until 2012, lecture notes' being available online was the highest rated item that students desired. Data show faculty have been responsive to providing the resources, such as online lecture notes, that students want.